


Introduction
The Q2 2026 Domain Intelligence Report analyzes aftermarket sales pricing from Dynadot's own marketplace data, April–June 2026, benchmarked against Q2 2025. It leads with medians and reports shares, ratios, and index values, making every finding citable.
Q2 saw typical sale prices hold steady, with value concentrated at both ends of the market and premium names defined largely by their structure. The story of the quarter is about pricing and composition, which makes it a useful read for anyone deciding how to price, list, or bid. It's written for domain investors, naming professionals, and analysts looking for transparent pricing benchmarks.
This report covers:
- Median vs. average pricing, year over year
- Value concentration by price band
- TLD, length, and naming signals
- What premium sales had in common
- Quality signals that moved price
Executive Summary
Q2 2026 was shaped by pricing a nd sales mix, highlighting typical sale prices, where aftermarket value was concentrated, and the traits shared by the highest-value domains. Four findings define the quarter:
- The typical sale price held flat year over year. The median was $18.87 almost exactly where it was in Q2 2025 - $18.85. The listing mix shifted toward lower-priced inventory; the typical domain continues to be affordable.
- Value sits at both ends of the market. Roughly 89% of orders closed under $50, and that group and the top of the market contributed comparable shares of total value.
- Premium sales share a distinct profile. Among sales above $5,000, not a single domain was hyphenated or internationalized, and close to 58% were five characters or shorter, compared with 13.1% of sales under $50.
- Structure marked the premium tier more clearly than subject matter. The signal that separated the top of the market was cross-TLD registration: premium names were already registered across many other extensions.
Key numbers at a glance
| Signal | Reported Figure (Q2 2026) |
| Median sale price Growth, year over year | $18.87 vs $18.85 (+0.1%) |
| Share of orders closing under $50 | 88.9% |
| .com share of aftermarket orders | 70.6% |
| .com share of sales above $5,000 | 60.0% |
| Sales above $5,000 that were 5 characters or shorter | 57.5% |
| Median cross-TLD registrations, $5,000+ sales vs all sales | 26 vs 2 |
Methodology
Marketplace data
This analysis draws on more than 54,000 completed aftermarket sales in Q2 2026.
How to read the numbers
Medians lead throughout, because averages move whenever the listing mix moves. Averages are labelled wherever they're quoted, and index ratios are rounded.
Age, backlink, and cross-TLD data are not supplied for backorders, so backorders are excluded from every quality analysis (this is stated where relevant). This edition reports no buyer geography, because the dataset contains no reliable location signal.
Premium-sale characteristics describe sales that occurred. They are not a statement of cause, and nothing in this report is advice on what to buy or register.
1. Domain Pricing On Our Marketplace
The typical domain sold for the same price it did a year ago: the median moved just one tenth of one percent, from $18.85 to $18.87.
The median sale price remained stable year over year, while the transaction shifted toward lower-priced sales. When the median holds steady and the average moves, the mix is usually doing the work. Q2 2025 carried a heavier tail of very large sales, while Q2 2026 brought a broader base of lower-priced inventory to the market. The prices buyers paid for comparable names held; the composition of what sold changed.
2. How Order Price Shapes Aftermarket Volume and Value
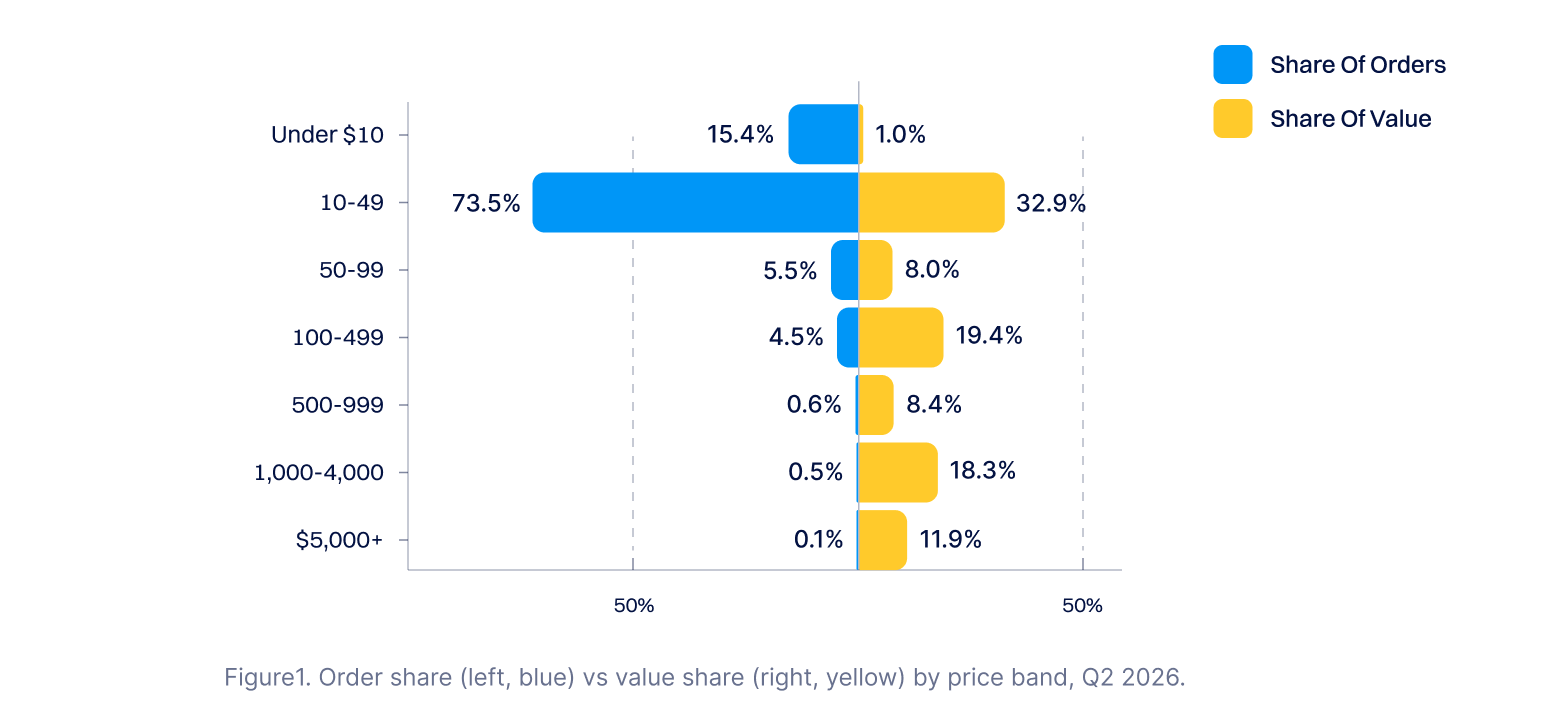
Under 1% of aftermarket orders generated close to a third of marketplace value, and so did the entire sub-$50 tier.
- The top of the market: orders above $5,000 were roughly seven in ten thousand, and carried 11.9% of value on their own.
- The volume tier: 88.9% of orders under $50 produced 33.9% of value.
- The $1,000+ tier: under 1% of orders, contributing close to a third of value.
The marketplace floor and the marketplace summit contribute about equally, from bases three orders of magnitude apart. The aftermarket reads as a volume business and behaves as a long-tail one at the same time, which is why single-metric summaries of it tend to miss half the picture.
Where orders live vs where value lives, Q2 2026
3. TLDs, Length, and Naming Signals
TLD choice and name length both shape price, though some naming signals carry more weight than others.
.com led transaction volume
.com took seven in ten orders, and 354 distinct TLDs traded in Q2 2026. Volume and price rank close to inversely: .com holds 70.6% of orders at roughly 1.0x the market average, because it is where the high-volume, lower-priced end of the market transacts, while the highest-priced extensions each sit under 1% of volume.
.io is the honest premium story here, with a median of $61.49, more than three times the market median.
.us shows a 2.74x average but a $14.95 median; that average is driven by a few large sales and shouldn't be quoted on its own.
| TLD | Share of orders | Median | Avg vs market |
| .com | 70.6% | $18.87 | ~1.0x |
| .org | 6.4% | $18.52 | ~0.9x |
| .cc | 4.1% | $16.79 | ~0.5x |
| .net | 3.9% | $20.51 | ~0.9x |
| io | 0.6% | $61.49 | ~2.9x |
| .us | 0.6% | $14.95 | ~2.7x (tail-driven) |
Short names raised peak prices
Length was one of the quarter's clearest pricing patterns, but it worked in a more specific way than "shorter is more expensive." Here's how the numbers break down:
- The short-name premium: names of 1 to 5 characters averaged roughly 1.6x the market price, the strongest length premium in the dataset.
- The curve: it falls steadily as names get longer, bottoming out in the 11-to-15 character range at roughly 0.8x.
- The long tail: past 15 characters the curve flattens, and names of 21+ characters priced slightly above the 16-to-20 band.
- By channel: the effect is steepest in user auctions and gentlest in expired auctions.
- The median: $18.87 in every length bucket, a nuance most length analyses miss.
What does that last point mean in practice? Averages rise for short names, but the typical sale price holds. Brevity doesn't make the ordinary sale more expensive, it raises the odds of an exceptional one. Short names lift the ceiling of what a domain can sell for, not the floor of what it usually does.
Numbers priced high, hyphens priced low
Two naming patterns stood out clearly in Q2, one in each direction.
Pure numeric labels were rare but valuable. Domains made up entirely of digits accounted for 0.6% of orders, and averaged roughly 2.5x the market price.
Hyphenated names traded below the market. Domains containing a hyphen made up 5.0% of orders and averaged around 0.7x the market price, so sellers pricing hyphenated inventory should benchmark it against that band rather than the overall market average. Buyers consistently paid less for names broken up by punctuation.
Among keyword themes, just three priced meaningfully ahead of the market:
- green energy at 1.36x
- agents and bots at 1.17x
- general tech at 1.14x
Every other keyword theme is priced at or below the market.
How AI naming showed up in Q2
This measures AI keyword strings inside domain names across all extensions. It is not a read on the .ai extension, which is reported separately below.
Domains containing an AI keyword priced in line with the market in Q2: their average sat at roughly 1.0x the market price, and their median, $18.87, matched the market median exactly. Because AI keywords appear in names across every price band and every extension, the keyword on its own didn't shift the typical sale price.
One note on how we counted them: simply searching for "ai" inside a name catches far too much, since words like chair, email, and domain all match. We used word-level matching instead, which still catches genuine AI names like aitools.com.
On the .ai extension itself: .ai surfaced at the premium end of the quarter, including one of Q2's ten largest sales. We aren't publishing an extension-level index for .ai this edition, because its volume is thin enough that a small number of large sales dominate any average and the figure wouldn't be a reliable benchmark.
4. Premium Sales Common Characteristics
The quarter's most expensive domains looked remarkably alike: short, clean, and unhyphenated.
The quarter’s largest sales
| Growth rank | Domain | Price | Listing type | Month |
| #1 | tenvels.com | $25,000.00 | Buy-It-Now | June |
| #2 | betzz.com | $15,210.88 | Expired auction | April |
| #3 | personio.ai | $13,023.61 | User auction | April |
| #4 | 2290.com | $12,909.88 | Expired auction | May |
| #5 | 5jl.com | $10,211.02 | Expired auction | April |
| #6 | glws.com | $9,999.00 | Buy-It-Now | June |
| #7 | 4439.com | $9,910.88 | Expired auction | April |
| #8 | tgh.com | $9,772.80 | Backorder | May |
| #9 | dyno.org | $8,888.00 | Buy-It-Now | May |
| #10 | d43.com | $8,888.00 | Buy-It-Now | June |
One sale is omitted under the report’s brand-safety rule; it remains in every cohort statistic below.
Shared characteristics by price cohorts
Among Q2’s largest sales, not one domain was hyphenated, and more than half were five characters or shorter.
Every gradient below moves in one direction as price rises.
| Characteristic | All orders | Under $50 | $1,000+ | $5,000+ |
| Average label length | 10.2 | 10.4 | 8.6 | 6.0 |
| 5 characters or fewer | 14.0% | 13.1% | 26.8% | 57.5% |
| Pure numeric | 0.6% | 0.6% | 1.4% | 5.0% |
| Hyphenated | 5.0% | 5.2% | 3.4% | 0.0% |
| Internationalized (IDN) | 0.4% | 0.4% | 0.3% | 0.0% |
| .com share | 70.6% | 71.6% | 61.9% | 60.0% |
| Sold via Buy‑It‑Now | 15.7% | 16.5% | 39.5% | 60.0% |
| Median cross‑TLD registrations | 2 | 1 | 7 | 26 |
What changes as prices rise: Characteristics by price cohort, Q2 2026
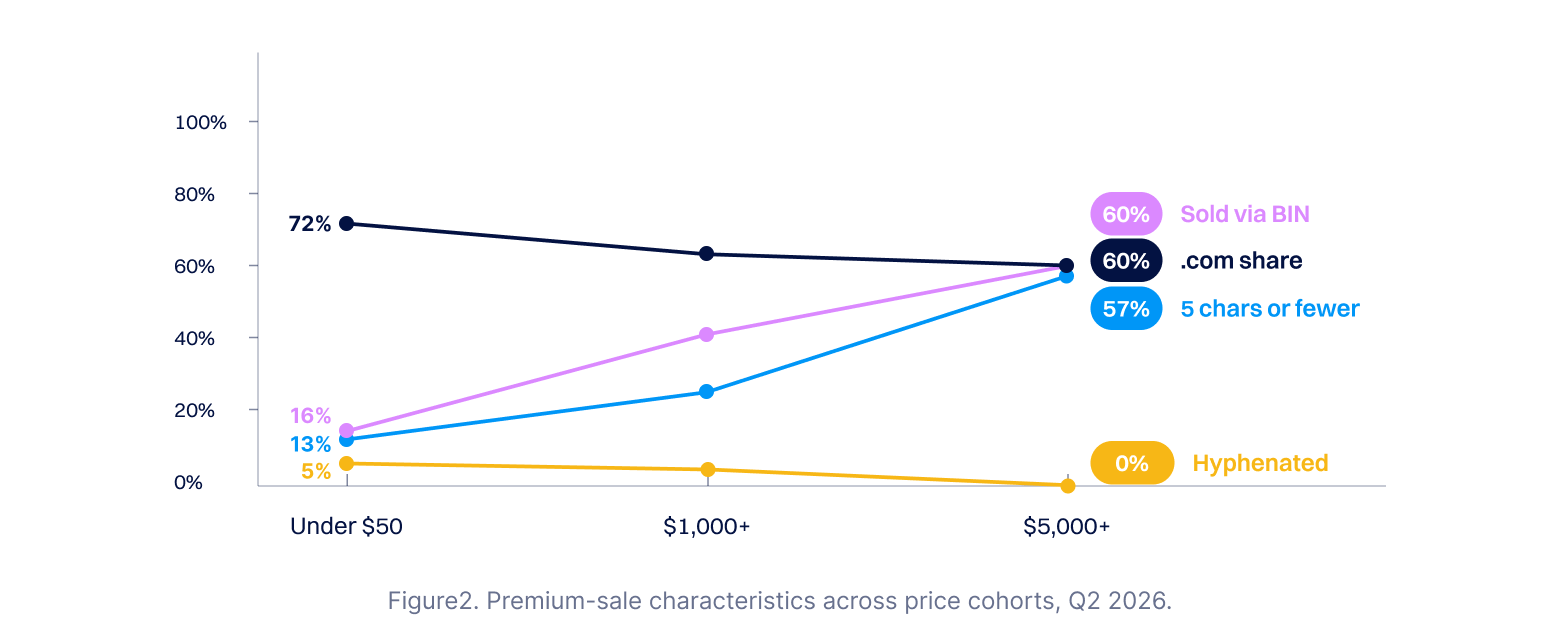
Reading the table from the strongest signal down:
- Brevity is the clearest marker. The share of five-character-or-shorter names more than quadruples between the floor and the top tier.
- Hyphens and IDNs are absent above $5,000. They thin out through the mid-tiers and reach zero at the top.
- Cross-TLD registration separates the tiers. Premium names were already registered in 26 other TLDs, against 2 market-wide.
- Buy-It-Now carries the premium tier. It accounted for 60% of sales above $5,000, against 16.5% of the sub-$50 floor, which makes it the channel where high-value names most often close.
- The premium end is more TLD-diverse. .com share eases from 71.6% at the floor to 60.0% at the top, so non-.com extensions are better represented among the largest sales than among the smallest.
5. Which Quality Signals Actually Moved Price
This section covers expired, BIN and user auction sales only. Backorders are excluded because age, backlink and cross-TLD data are not supplied for that channel. Figures are medians per bucket rather than averages, because the price distribution is wide enough that averages mislead.
Quality signals and the typical sale price, Q2 2026 (backorders excluded)
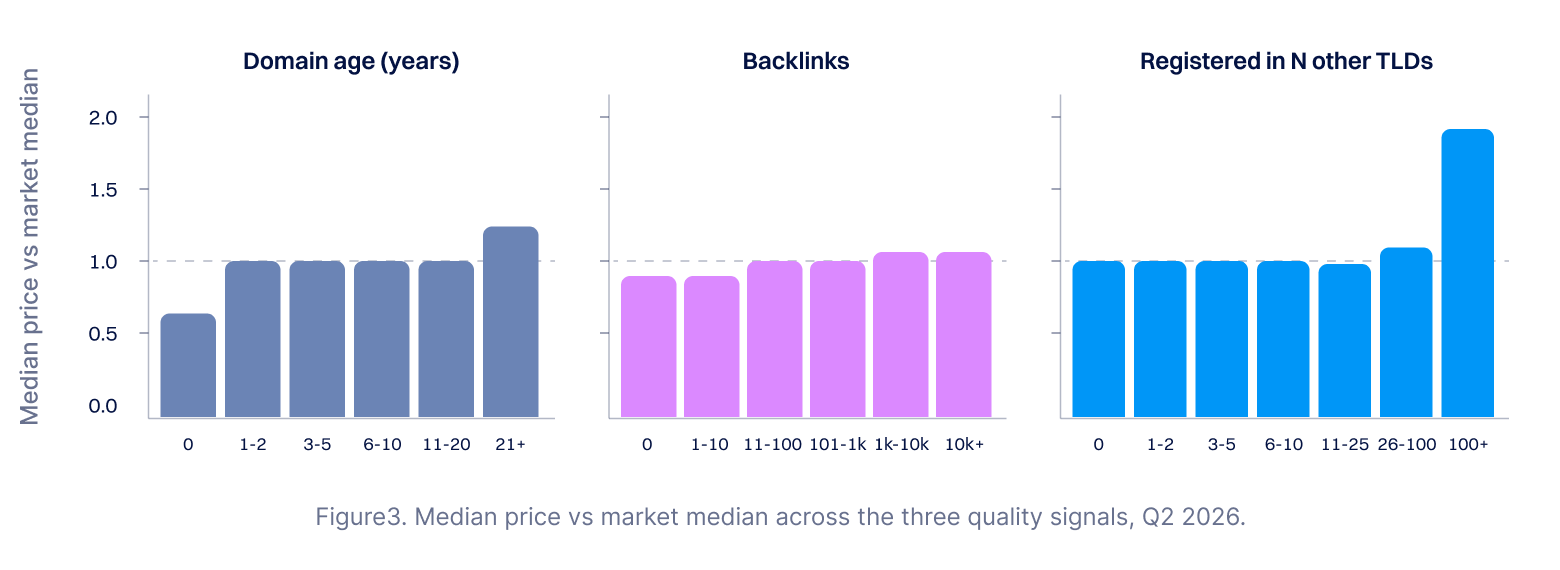
Age showed limited correlation with the typical sale
A domain's age made almost no difference to what it typically sold for. From 1 year old to 20, the median price sat exactly at the market median with no gradient. Only two ends of the range behaved differently: brand-new or recently reset names sold at ~0.6x the market price, and names older than 21 years carried a modest premium at ~1.3x.
The takeaway is that age raises the odds of an exceptional sale, not the price of an ordinary one. An older domain has had more time to accumulate whatever makes a name valuable, but by itself, age isn't what buyers paid for.
Backlinks showed limited correlation with price
Zero-link names are priced slightly below the market median(at ~0.9x), and past that threshold, the movement is very slow. A name with ten thousand backlinks carried a median just 5% above one with fifty.
The premium cohort points the same way, with a median of 14 links among $5,000+ sales against 18 market-wide. For a market that often quotes link counts in listings, that's worth knowing when you're weighing what to pay for.
Cross-TLD registration is the signal that works, and it behaves like a threshold
Cross-TLD registration counts how many other extensions the same name is already registered in. In effect, a measure of how many other people wanted that string.
It behaves like a threshold rather than a gradual slope. Below 26 other registrations, the count tells you little about price. Past that point the median starts climbing, and names registered in more than 100 other extensions sold for nearly twice the typical price.
It's also the only quality signal that keeps working at the very top of the market. The median $5,000+ sale was registered in 26 other TLDs against 2 market-wide, around thirteen times as many. What premium names have in common is demonstrated demand for the string itself.
Which signal dominates?
None of them everywhere, and that's the finding. Each signal works in a different part of the market, which is why no single metric prices a domain on its own.
- Across the broad market: age tracks price most closely in rank terms (+0.43), largely because brand-new names cluster in the lower price bands.
- At the premium tier: age and links stop distinguishing, and cross-TLD demand and brevity take over. The median $5,000+ sale was no older and no better-linked than the median $19 sale. It was half the length and registered across roughly thirteen times as many extensions.
- Length is the most unusual of the four: it shows no correlation with price overall, because the median is flat across every length bucket, yet it produces the sharpest shift of any characteristic at the premium tier. Length does not price the typical sale; it selects for exceptional ones.
Conclusion
Q2 2026 was a story about price and composition. The typical domain sold for almost the same price as a year ago, at a median of $18.87, while the movement in the average reflected a mix that shifted toward lower-priced inventory.
Beneath that steady headline, value sat at both ends of the market. The 88.9% of orders under $50 and the under-1% at $1,000 or above produced roughly equal value.
What separated the top of the market was structure. Premium names were short, clean, and already registered across many other extensions, while age and backlinks showed limited correlation with the typical sale. Demonstrated demand for the string itself defined the quarter's most expensive domains.